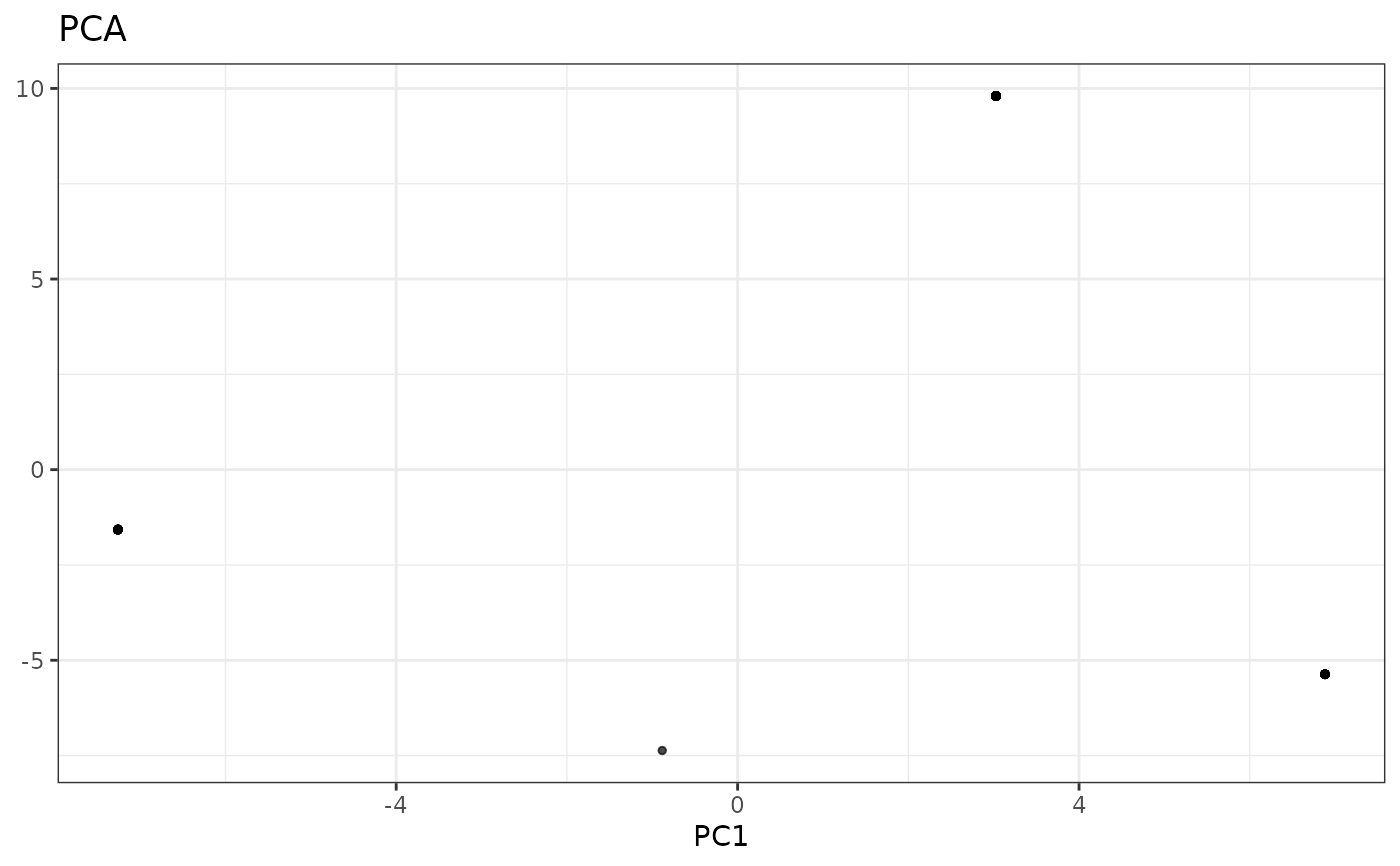
Plots a scatter plot of the indicated dimensional reduction results.
Usage
reducedDimPlot(
  TapestriExperiment,
  alt.exp = "alleleFrequency",
  dim.reduction,
  dim.x = 1,
  dim.y = 2,
  group.label = NULL
)
Arguments
- TapestriExperiment
TapestriExperimentobject- alt.exp
Character,
altExpto use,NULLuses top-level/main experiment. Default "alleleFrequency".- dim.reduction
Character, dimension reduction to plot, either "PCA" or "UMAP".
- dim.x
Numeric, index of dimensional reduction data to plot on X axis. Default 1.
- dim.y
Numeric, index of dimensional reduction data to plot on Y axis. Default 2.
- group.label
Character,
colDatacolumn for grouping samples by color. DefaultNULL.
Examples
tap.object <- newTapestriExperimentExample() # example TapestriExperiment object
#> ℹ Moving gRNA probe  to `altExp` slot "grnaCounts".
#> ℹ Moving barcode probe  to `altExp` slot "barcodeCounts".
#> ℹ Moving chrY probe(s) probe_231, probe_232, probe_233, probe_234, probe_235, probe_236, probe_237, probe_238, probe_239, and probe_240 to `altExp` slot "chrYCounts".
tap.object <- runPCA(tap.object, alt.exp = "alleleFrequency")
reducedDimPlot(tap.object, dim.reduction = "pca")