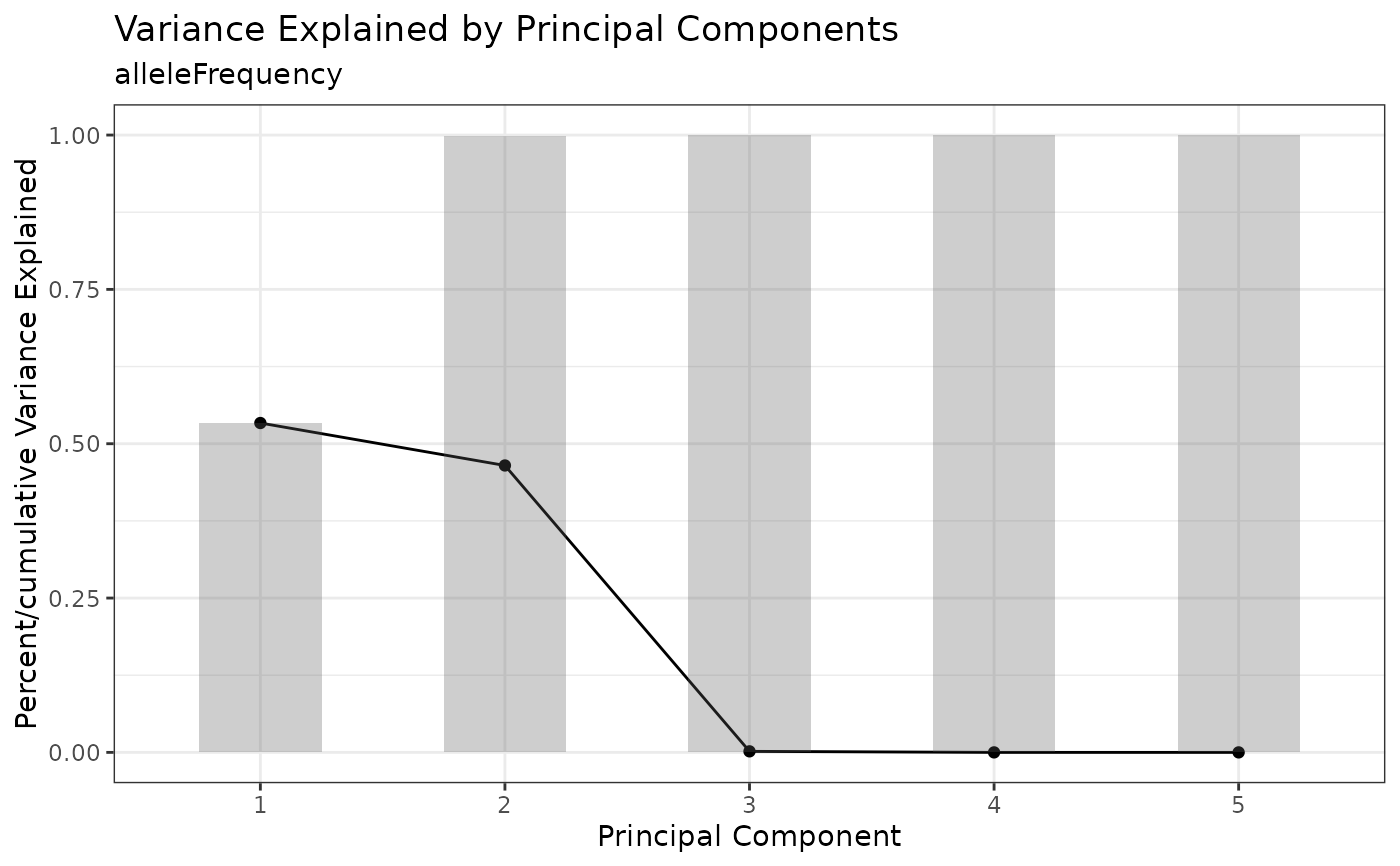
Draws "knee plot" of PCA proportion of variance explained to determine which principal components (PCs) to include for downstream applications e.g. clustering. Variance explained for each PC is indicated by the line. Cumulative variance explained is indicated by the bars.
Examples
tap.object <- newTapestriExperimentExample() # example TapestriExperiment object
#> ℹ Moving gRNA probe  to `altExp` slot "grnaCounts".
#> ℹ Moving barcode probe  to `altExp` slot "barcodeCounts".
#> ℹ Moving chrY probe(s) probe_231, probe_232, probe_233, probe_234, probe_235, probe_236, probe_237, probe_238, probe_239, and probe_240 to `altExp` slot "chrYCounts".
tap.object <- runPCA(tap.object, alt.exp = "alleleFrequency")
PCAKneePlot(tap.object, n.pcs = 5)