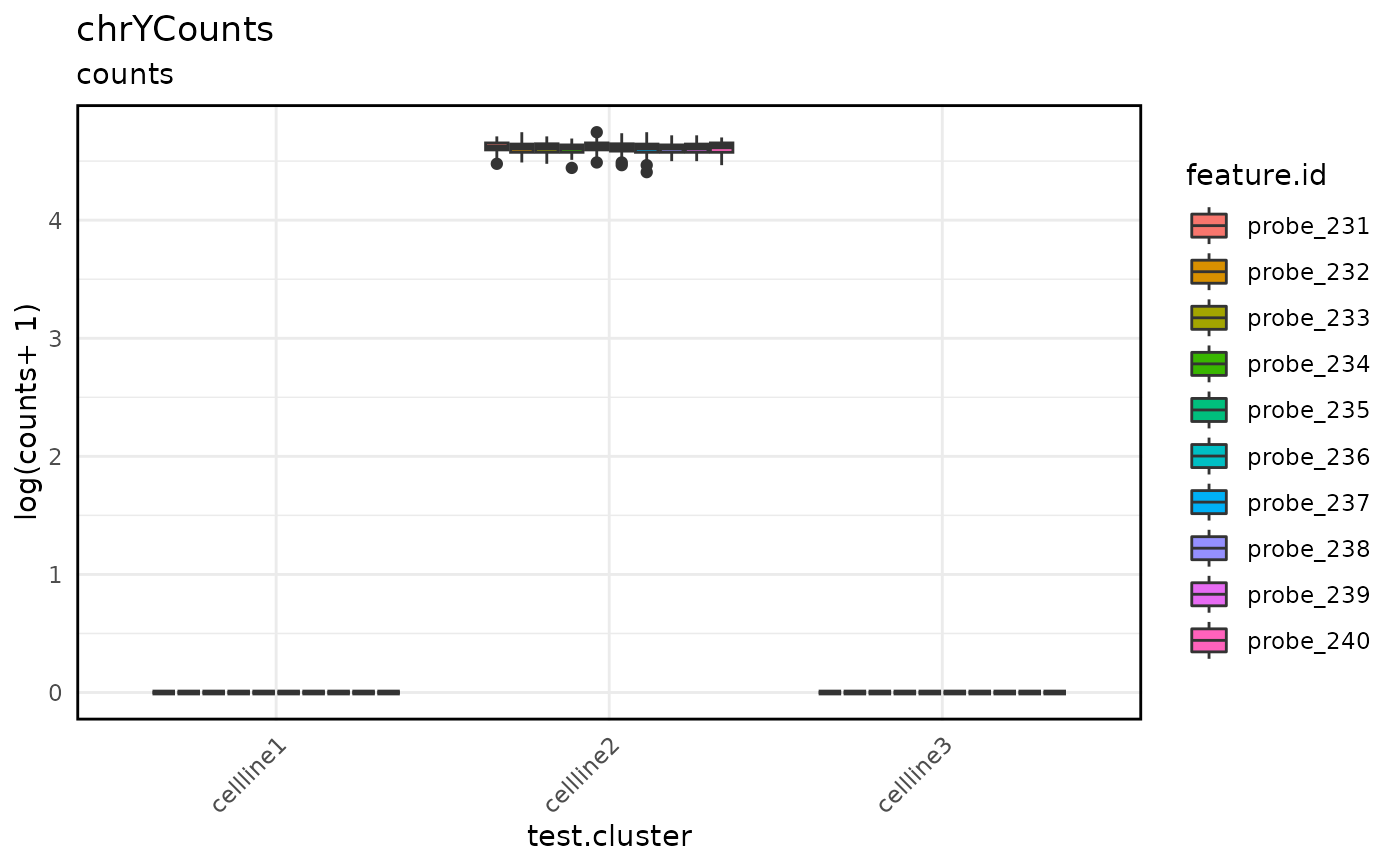
Draws box plot of data from indicated TapestriExperiment assay slot.
This is especially useful for visualizing altExp count data, such as counts from
probes on chrY or barcode probe counts.
Usage
assayBoxPlot(
  TapestriExperiment,
  alt.exp = NULL,
  assay = NULL,
  log.y = TRUE,
  split.features = FALSE,
  split.x.by = NULL,
  split.y.by = NULL
)
Arguments
- TapestriExperiment
TapestriExperimentobject- alt.exp
Character,
altExpto plot.NULL(default) uses the top-level experiment inTapestriExperiment.- assay
Character, assay to plot.
NULL(default) selects first assay listedTapestriExperiment.- log.y
Logical, if
TRUE, scales data usinglog1p(). DefaultTRUE.- split.features
Logical, if
TRUE, splits plot byrowDatafeatures if slot has more than one row feature/probe. DefaultFALSE.- split.x.by
Character,
colDatacolumn to use for X-axis categories. DefaultNULL.- split.y.by
Character,
colDatacolumn to use for Y-axis splitting/faceting. DefaultNULL.
Examples
tap.object <- newTapestriExperimentExample() # example TapestriExperiment object
#> ℹ Moving gRNA probe  to `altExp` slot "grnaCounts".
#> ℹ Moving barcode probe  to `altExp` slot "barcodeCounts".
#> ℹ Moving chrY probe(s) probe_231, probe_232, probe_233, probe_234, probe_235, probe_236, probe_237, probe_238, probe_239, and probe_240 to `altExp` slot "chrYCounts".
assayBoxPlot(tap.object, alt.exp = "chrYCounts", split.features = TRUE, split.x.by = "test.cluster")
#> Warning: The `size` argument of `element_rect()` is deprecated as of ggplot2 3.4.0.
#> ℹ Please use the `linewidth` argument instead.
#> ℹ The deprecated feature was likely used in the karyotapR package.
#>   Please report the issue at <https://github.com/joeymays/karyotapR/issues>.